
Benchmarks & Case Studies
Internal Logistics Optimisation in Assembly Manufacturing


The Company
The case presented here arose from the need to improve the internal logistics flow in an automotive antenna manufacturing industry.
The company in question has been experiencing a sharp increase in sales volume and consequent increase in production capacity, which has led to a greater demand on internal logistics operations, more specifically regarding supply and support to the production lines.
The factory has 42 production lines with different characteristics, 200 operators in final assembly and 14 operators allocated to logistics (divided into three shifts). Each shift can operate more than 20 assembly lines simultaneously, which requires a very organised and efficient process for the supply of components and collection of finished products.
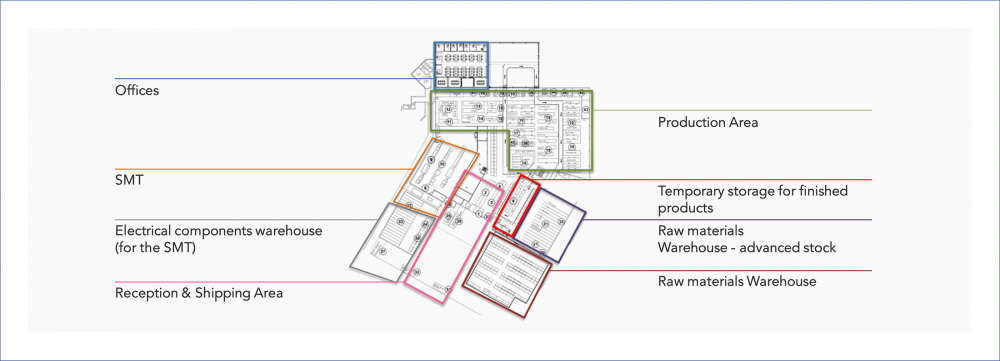
Layout of the factory with identification of the main areas
The Challenge
The increase in production had a negative impact on logistics, leading to more frequent supply failures, making it evident that the processes inherent to internal logistics were not adjusted to the new production volumes.
To better understand the material flow from the arrival of the components to the delivery of the final product to the customers, Value Stream Mapping (VSM) was designed in which the material flow was represented during the production of an antenna. Due to the wide variety of components, products and lines it was necessary to select a sample reference to map – antenna assembled on line 4.
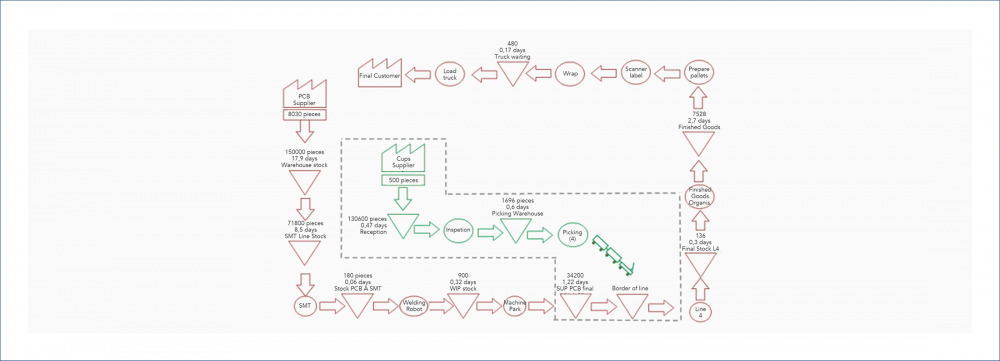
Representative VSM of the main flows in the production of an antenna
The analysis identified that the most critical problem concerned frequent stops of the production lines due to lack of components and consequent loss of productivity. It was found that the flow was not working in a synchronised way between production and logistics (warehouse), thus generating supply failures and a consequent negative impact on the productivity of logistics operators and lines.
It was also perceptible that the process of ordering from suppliers was not optimised, since there were both occurrences of excessive stocks and, on the other hand, frequent component stock-outs.
The focus of the project was the flow of material and information from raw material orders to the supply of these to the production lines. The main objectives identified were the elimination of line downtimes due to logistical supply failures (corresponding to about 2% of the opening time) and the reduction of raw material stocks by 25%.
The Approach
Following the principles of flow creation, a set of solutions was designed to eliminate waste and increase the global efficiency and productivity of the operation. The sizing of a raw materials supermarket*, restructuring of the supply cycle to the production lines (implementation of a mizusumashi**), and changes to the border of line were some of the improvements that contributed to the flow optimisation.
Before starting to design the solutions themselves for each of the cycles, it was fundamental to define some initial parameters such as the transport unit and the supply system (continuous – KANBAN – or sequenced – junjo) for each component.
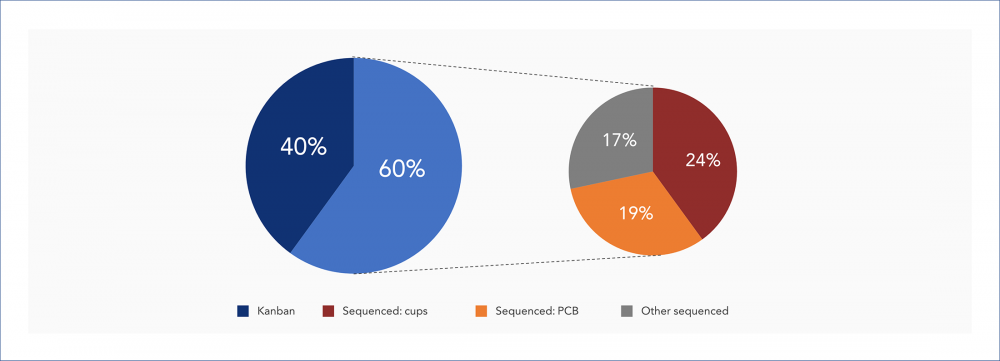
Representative graph of the proportion between KANBAN and junjo components
The lines were already supplied by a logistics train, but this did not follow a standard cycle and was not coordinated with the consumption flow at the border of the line. It was then necessary to ensure the dimensioning of a standard cycle considering several production scenarios. Based on the values obtained for each scenario and considering an extra safety margin to prevent errors in case of potential delays, it was then defined that the mizusumashi should comply with a standard cycle time of 30 minutes.
The estimation of the number of boxes moved per cycle allowed the dimensioning of the maximum load that the train would have to be able to accommodate and the ideal physical size of the train.
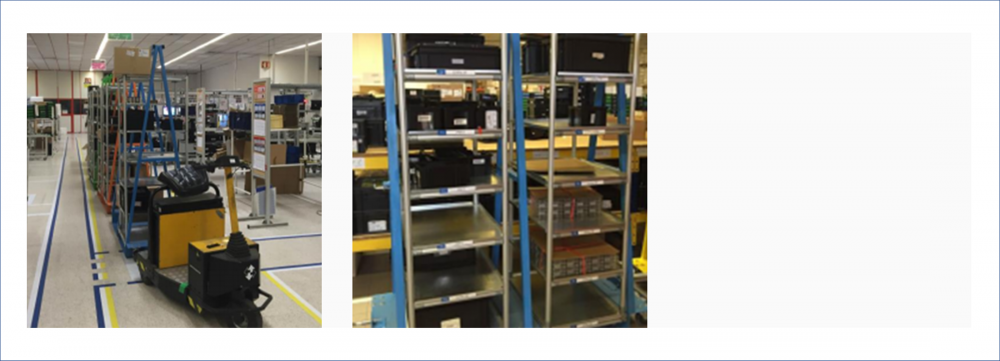
Physical solution developed for the mizusumashi
The implemented raw materials supermarket works as an interface between the cycle of small amounts (ensured by the logistics train to the border of the line) and the cycle of large amounts (warehouse). The big difference between the common warehouse that existed previously and the implemented supermarket is that its replenishment is done based on pull flow, triggered by line consumption, and controlled with a visual card system to facilitate picking.
It was necessary to dimension the raw materials supermarket ensuring a sufficiently large number of components to satisfy the needs of the lines while the replenishment order and replenishment process takes place.
The racks were organised not by product family or turnover, as is traditional, but by the production lines in which the components are used. The stopping points of the mizusumashi in the warehouse to carry out the picking of components are “coordinated” with the layout of the racks so that the colours of the carriages coincide with the colours of the racks, reducing the movements of the operator and increasing the ergonomics of the task.
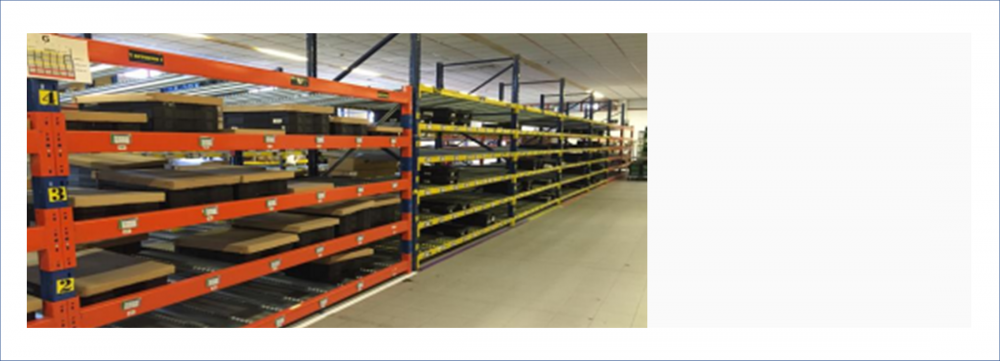
Design of racks for the component supermarket
To achieve the reduction of raw material stocks, the ordering model was changed from a Push logic to a Pull model, through the implementation of an order planning algorithm based on real consumption.
The developed algorithm calculates the level of replenishment and safety stock in a dynamic way so that order requirements are generated daily. The algorithm is updated when importing the SAP data and automatically creates the order proposal to be made to the supplier.
The Results
As a result of the transformation in internal logistics flows, a 52% reduction in downtime was recorded (from 2.13% average from January to September to 1.01% in the three months after implementation). This improvement together with other initiatives to optimise production flows led to an increase in the overall productivity of the plant to 7%, which is equivalent to freeing 14 operators from the assembly lines.
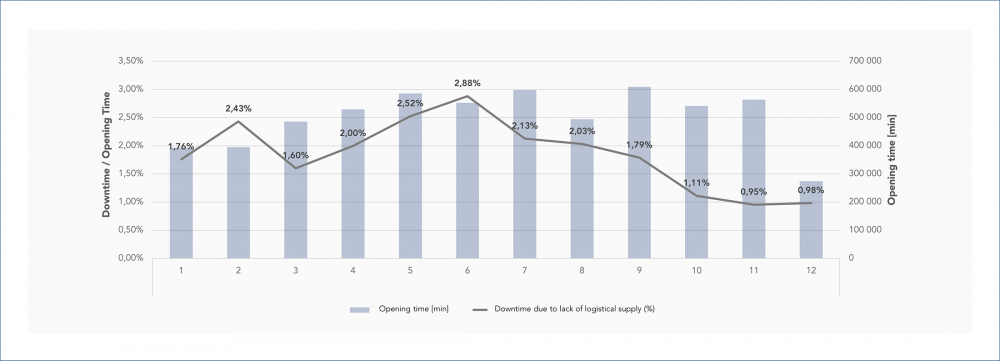
Evolution of Downtime due to Lack of Logistical Supply (% Opening Time)
With the use of the purchasing algorithm, the average coverage rate reduced by 39% for the suppliers included in the pilot. The success of the implementation of the pilot meant that the conditions were in place to introduce two new suppliers to the algorithm per week.
* The supermarket is a component storage area with simple access and at ground level containing fixed locations, visually identifiable and respecting FIFO for each component or material.
** Logistics operator responsible for the physical movement of material following a standard route with a defined cycle time and route.
#assembly manufacturing #operations
See more on Assembly Manufacturing
Find out more about transformation in this sector
See more on Operations
Find out more about improving this business area