Case Study
The Role of Data Analytics in Creating Network Synergies


The company
This company is a leader in paper and office articles distribution. In 2019, the company completed the merger of two companies in the German market to extend its operation and market share.
This acquisition has led to the need to align all the information and standardize the whole process so that the operation can continue to run smoothly after the transition period.
However, before the merger, transport costs that used to represent 9.3% of the total invoice increased to 13% in 2021. A similar trend happened with warehousing costs that increased from 12% to 21%.
To maintain a profitable business, the company needs to understand where this cost is and how it can be reduced by increasing the synergies of the network.
The challenge
Currently, the company has 17 warehouses throughout the country. There are three main hubs: two in the north and one in the south. Each warehouse must fulfill the demand of its pre-defined region. Despite the decentralization of stock, there is an intra-logistic transport network that is used as a response to:
- Choice of stock allocation made by the commercial team.
- Issues with stock availability at preferred warehouses.
The average fleet occupation stands at around 70% across different sites, resulting from an almost fully interconnected network in place to respond virtually to any demand scenario and stock transfer requirements.
For local demand, each warehouse has a fleet of small trucks that perform pick-ups and deliveries directly to the customer. Customers are getting about 60% service levels because of the compound effect of 90% service level from intra-transport and then last-mile deliveries.
The approach
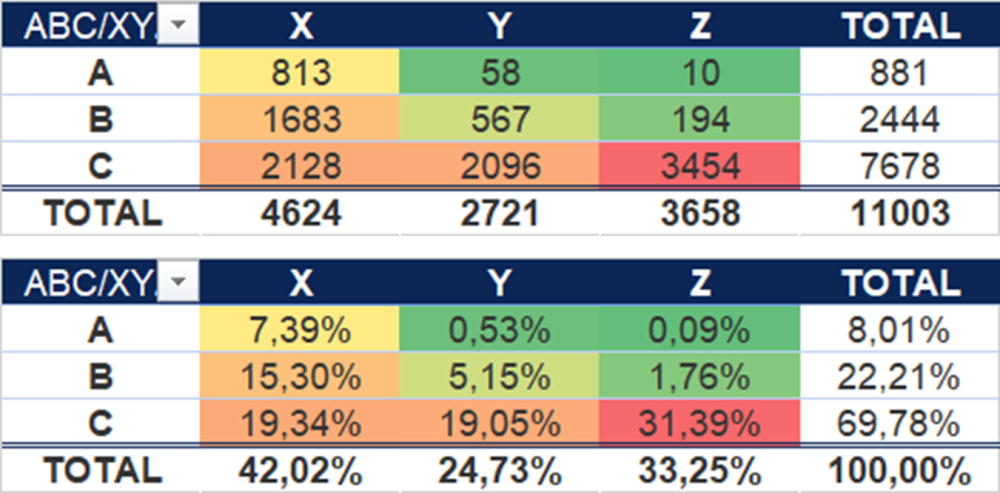
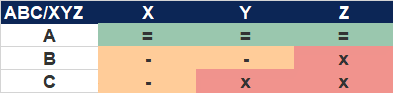
1. Redefine the keeping and buying stock strategy
The ABC XYZ analysis is fundamental to optimizing inventory. It starts by classifying each SKU based on its sales volume (ABC) and frequency (XYZ), which is a proxy to risk due to fluctuations.
This approach separates the SKUs into nine different classes that enable us to create a strategic rule for each category. For example, BZ, CY, and CZ references should have very low stock levels, and the strategy should be buy-to-order to avoid becoming obsolete, thus increasing turnover.
2. Review the stock replenishment algorithm
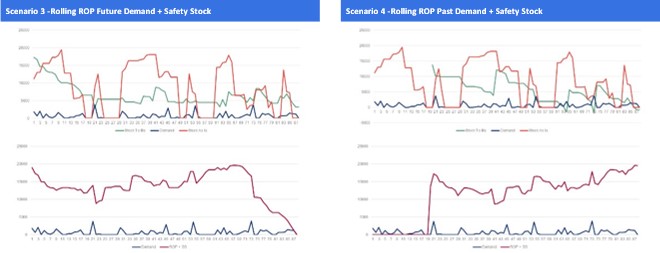
The stock replenishment algorithm must be fine-tuned to balance service levels and stock coverage correctly. In this exercise, we considered the global demand for the whole network and built two different scenarios: one that uses the data for future demand and the other that looks to past demand. The calculations were made for a period of three months, day by day, which accounts for any demand variability that may appear.
The first one leads to almost zero stockouts, but it relies on a very good sales forecast. The second one is more conservative but still shows a great balance between decreased stock levels and improved service levels.
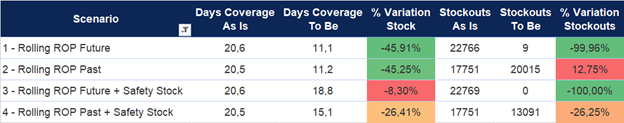
The stock evolution and comparison to current stock levels of a single reference can be seen below:
3. Improve fleet occupation
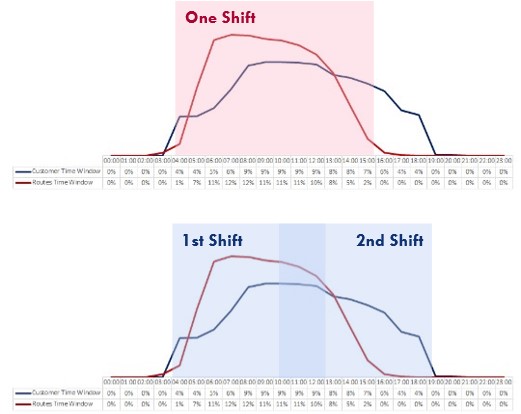
The trucks used for last-mile deliveries have a very low occupation, both in time and weight. In this analysis, it is essential to separate the driver and truck opening times. A driver might be available during his shift (8h), but the truck is available for the whole day, or at most, during the time window for delivery set by the clients.
The average occupation in terms of time was 33% which illustrates this effect. In the graph below, we can see that most routes last for a period of 8h (red line). The opportunity here is to create two shifts to maximize the customer time window (blue line) and, consequently, the vehicle time occupation and number of deliveries performed per day.
4. Design the best transport model
To study which transportation model should be adopted, we started by classifying the main suppliers and quantifying the demand volume for each region. Different scenarios were set to understand where each supplier should deliver and, consequently, where the stock should be placed. Each scenario considered the total number of km traveled, the number of trucks needed, and a penalty for every trip performed with sub-occupation.
![]()
5. Network design assessment
Criteria used to analyze if any warehouse should be eliminated:
- Hotspot of demand on geographical area and distance to other hubs/warehouses.
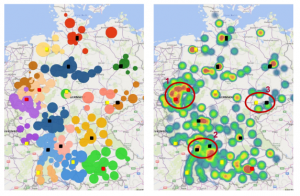
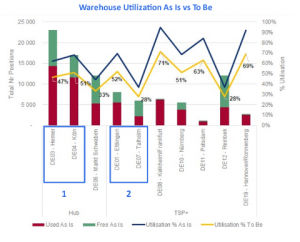
- Utilization rate of the warehouses.
- Overhead and local transport costs.
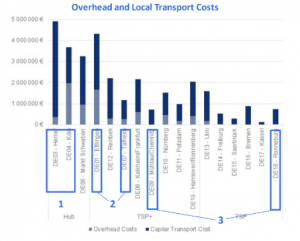
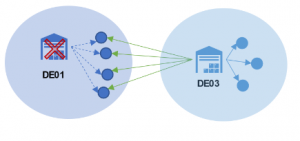
- Potential cost increase in last-mile delivery (whenever a warehouse is eliminated, the local demand must be reallocated).
Achievements
The estimated savings with the implementation of the improvements are:
- Stock reduction: 4.5M in cash savings: -260K in P&L
- Intra-transport cost reduction: 1.5M in savings
- Warehouse and network redesign: 360K in savings
See more on Warehousing & Distribution
Find out more about improving this business area
See more on Analytics
Find out more about improving this business area